
We use cookies to ensure you get the best user experience on our website.Find Out More
Simplify how developers, client stakeholders, and QA teams collaborate. Capture annotated browser screenshots, record step-by-step videos, and automatically attach technical console errors and API request headers.
From visual elements to network API request payloads, debug client side issues instantly.
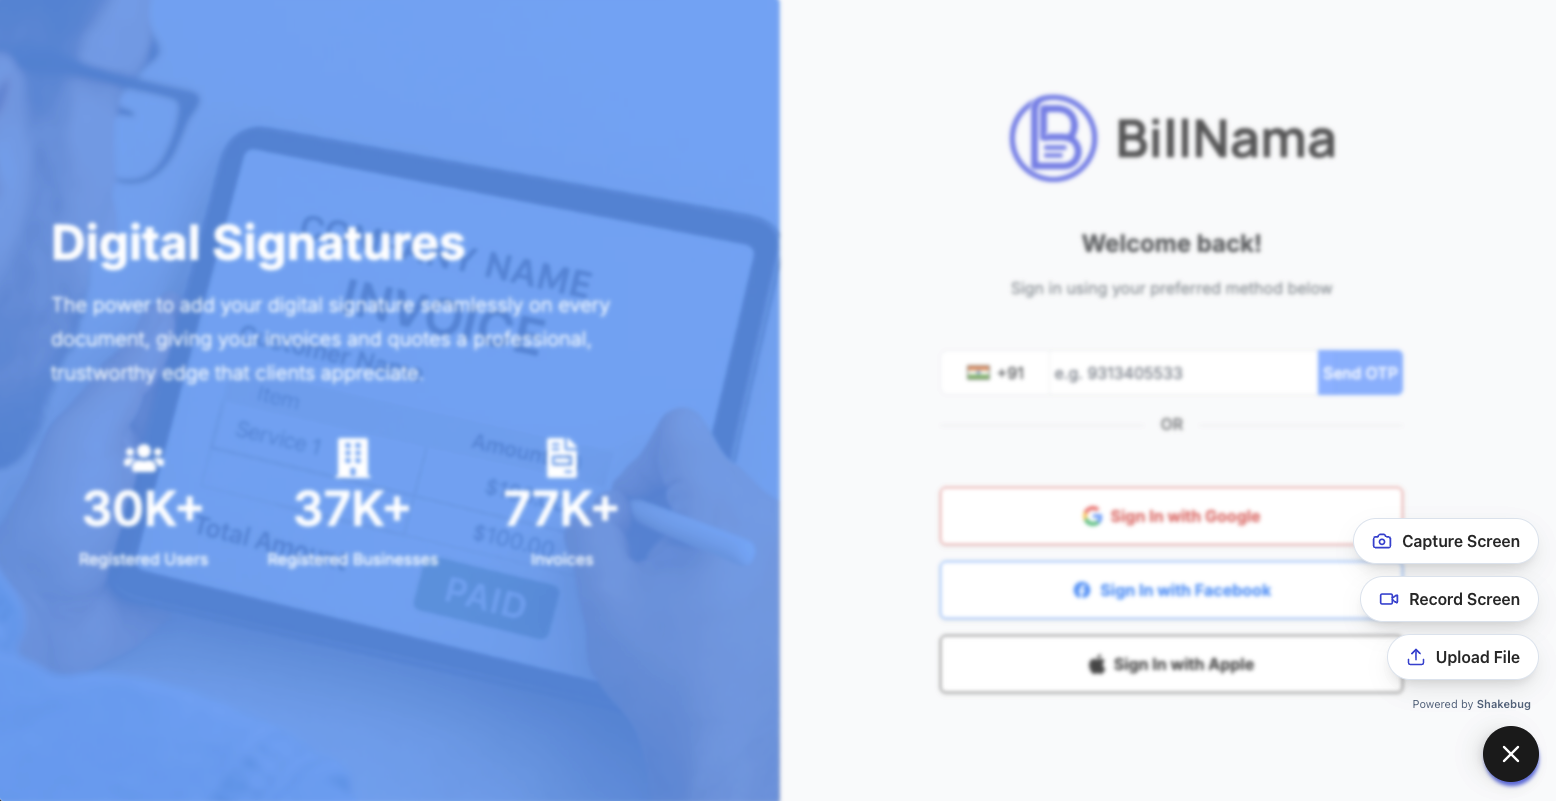
Open your website. Launch the report window by clicking the Shakebug widget in the corner or pressing the shortcut keys: Ctrl+Alt+K (Cmd+Opt+K on Mac).
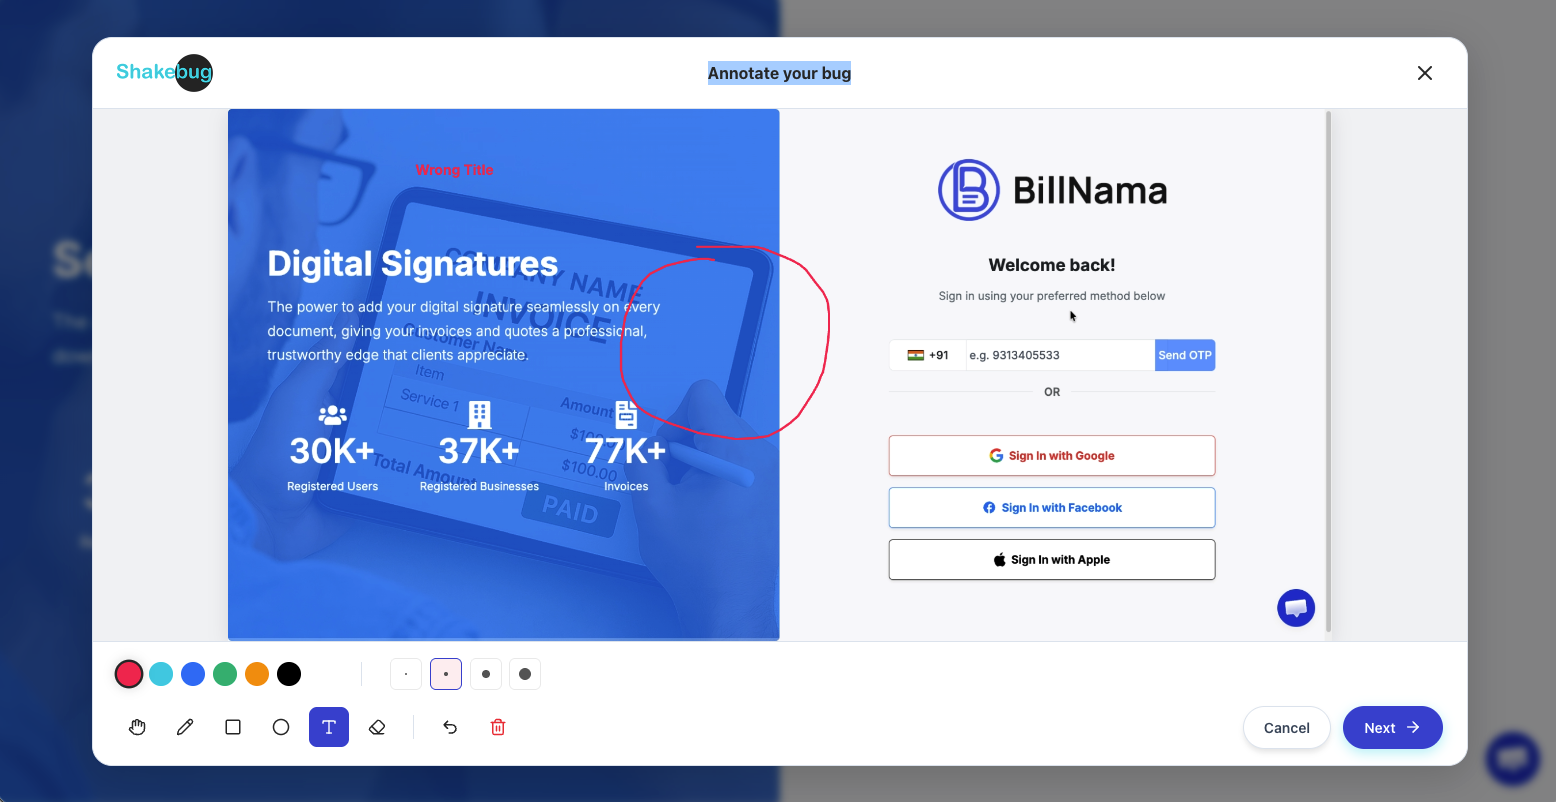
Use annotation tools to highlight layout bugs, draw pointers, or blur out personal data before sending the feedback to developers.
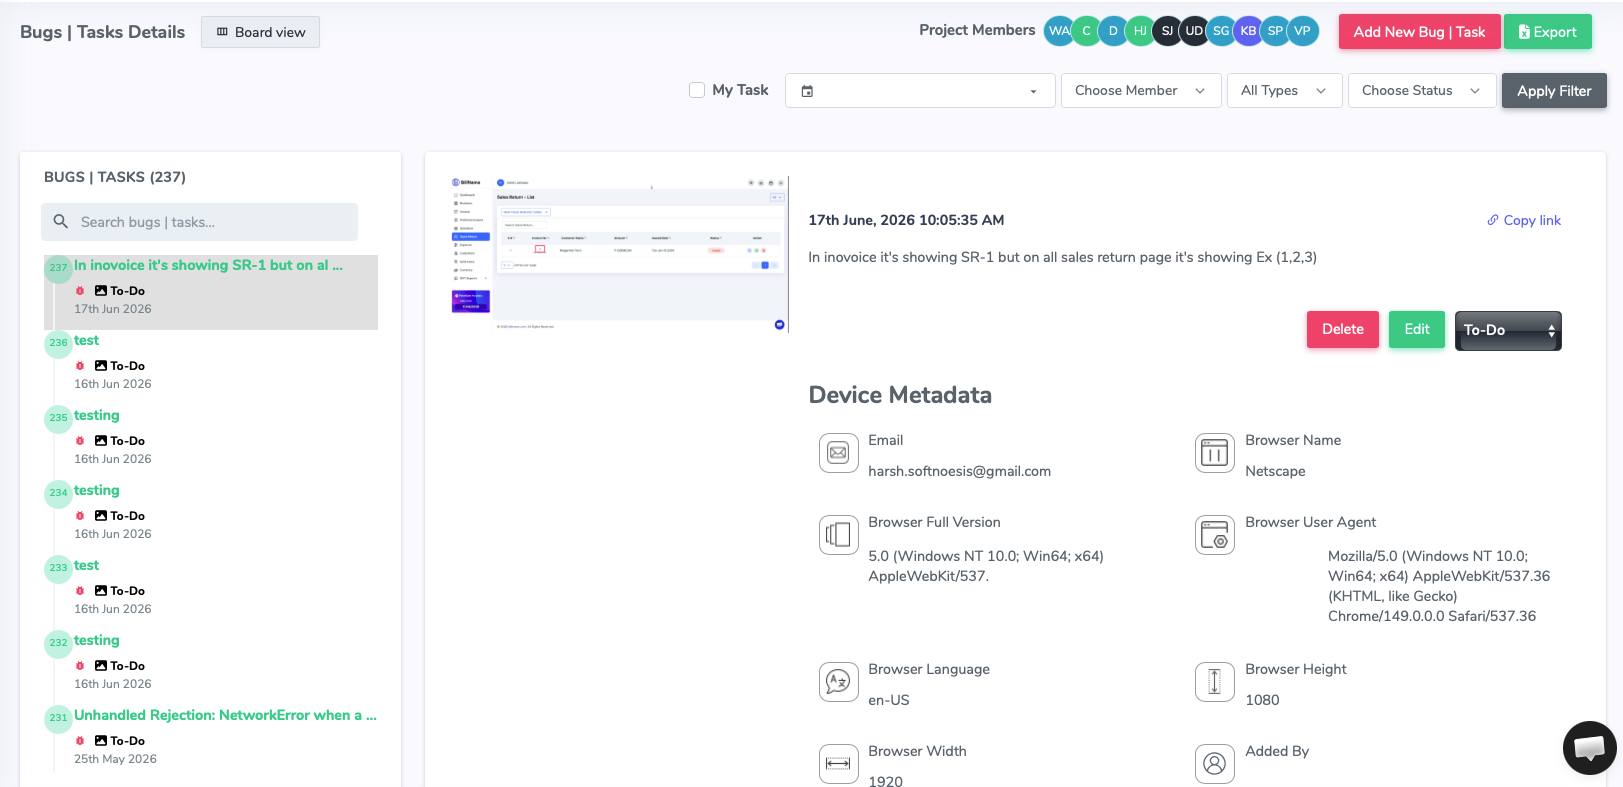
Submit your report. Assigned developers receive the ticket with full device specifications, OS version, browser build, viewport sizes, network logs, and JS console history.




































Unlike traditional platforms where users must manually document steps, Shakebug runs inside your website or browser tab, capturing screenshots, system specs, and console/network logs in a single click.
Yes. Shakebug is flexible and scalable. You can manage multiple websites, invite unlimited QA testers, and synchronize tasks directly to team workspaces.
Yes. You can brand reports, add custom metadata, filter out sensitive data inputs, or restrict the reporting widget to specific environments.
Absolutely. Shakebug features deep, direct integrations. When a bug is submitted, it instantly creates tickets or sends notifications to your configured channels.