We use cookies to ensure you get the best user experience on our website.Find Out More
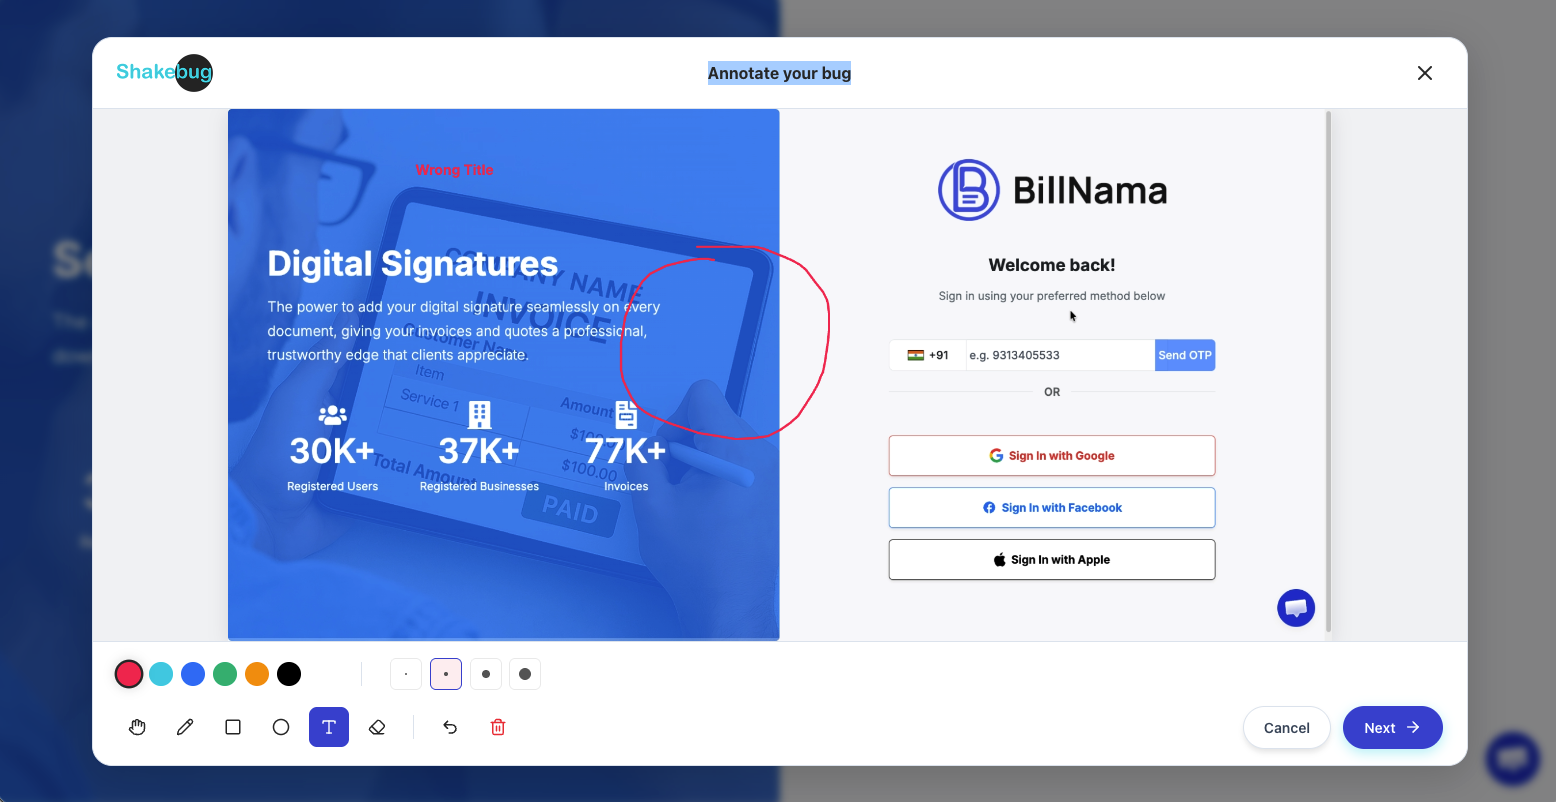
React applications often hide complex component states, asynchronous fetch events, and runtime errors. Shakebug captures annotated visual screenshots and records console warnings and failed API endpoints automatically.
Direct integration with React's core lifecycle APIs and hooks for front-end debugging.
Shakebug integrates with React's custom Error Boundary components to capture JS execution failures, protecting your application lifecycle while forwarding stack traces to developers.

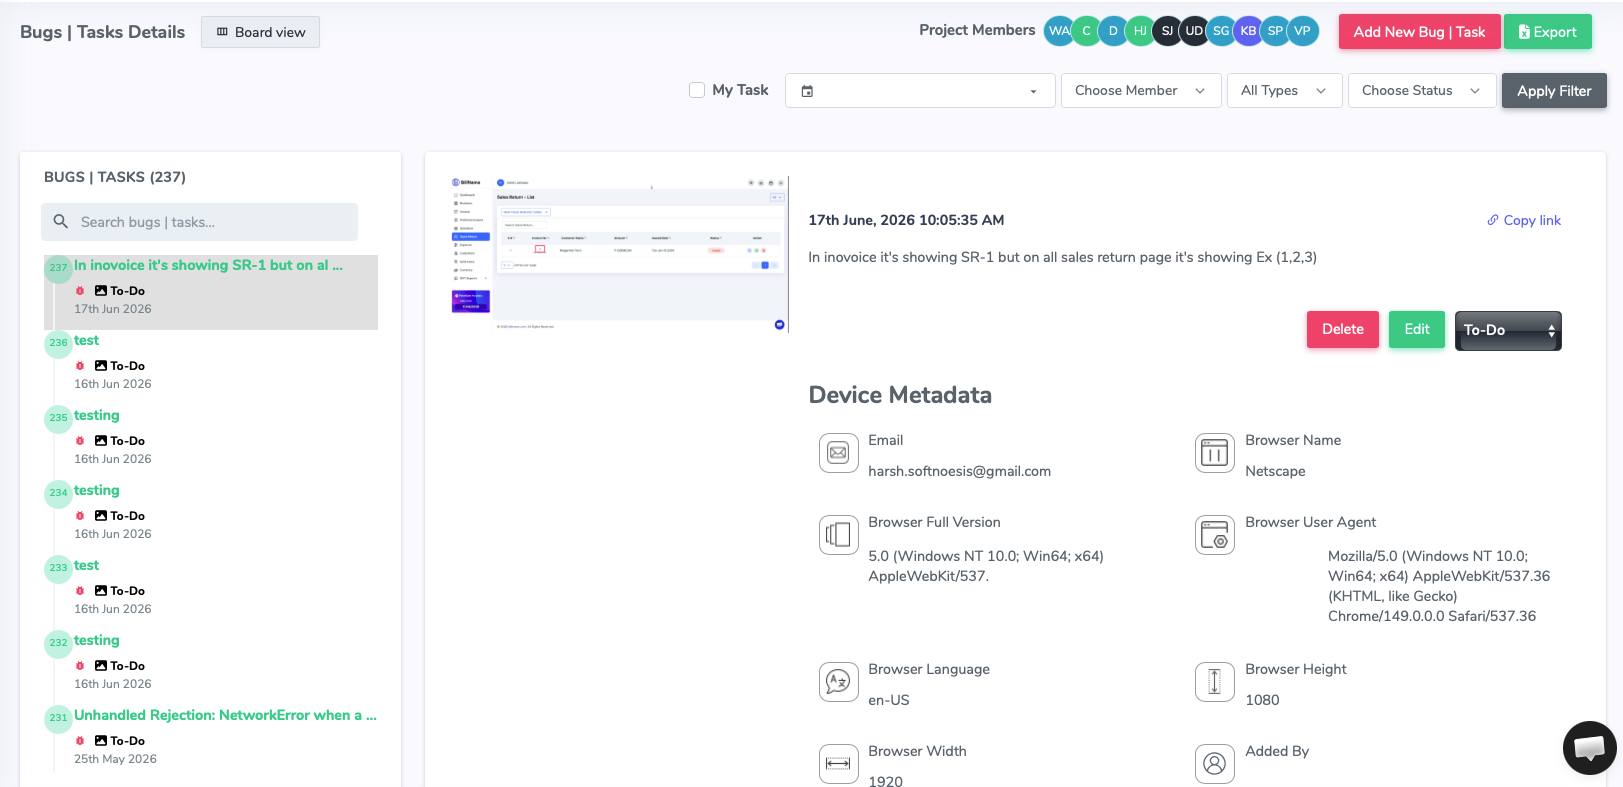
Log all asynchronous API requests and server-side responses made from your React views. Quickly check latency, status headers, and request errors inside the reporting board.
Compile standard console.log inputs and custom Redux actions chronologically up to the point of failure, showing developers the exact path taken to hit the bug.


Shakebug captures component-level crashes by hooking into React Error Boundaries and global window error events, providing clean stack traces with component path parameters.
Yes. You can pass custom logs or state snapshots programmatically, or register a custom Redux middleware to log actions chronologically alongside bug reports.
Yes. Shakebug automatically intercepts standard console.warn and console.error calls, attaching them to tickets so developers see runtime issues immediately.
You can configure your CI/CD pipeline to upload React Webpack or Vite build source maps, allowing Shakebug to translate minified javascript traces back to clean JSX lines.