
We use cookies to ensure you get the best user experience on our website.Find Out More
Catch production crashes before your users report them. Real-time stack traces and release regressions.
Deliver stable 99.9% crash-free mobile experiences. Shakebug monitors crash-free users, symbolicates iOS and Android stack traces down to the exact source line, and uses AI clustering to merge duplicate errors automatically.
Diagnose complex memory errors, native signal crashes, and release regressions across iOS, Android, Flutter, and React Native.
Monitor Crash-Free Users % and Crash-Free Sessions % in real time. Set SLA alerts and safeguard app store ratings.
Automated iOS dSYM processing and Android ProGuard / R8 mapping resolution. Pinpoint the exact line of failing source code.
Compare new app versions side by side. Instantly spot regressions and spike alerts during phased rollouts.
AI clusters duplicate stack traces into unified issues, prioritizing fixes by affected user percentage and device frequency.
Resolve crashes faster with structured stack traces, user breadcrumbs, and intelligent clustering.
Exact stack trace string matching fails when code builds shift by a line number or an Android OEM modifies standard libraries. Triage boards end up clogged with hundreds of duplicate tickets.
Shakebug's Crash AI clusters recurring stack traces by semantic pattern. All occurrences of the same underlying defect roll into a single issue with first-seen timestamps, frequency velocity, and affected OS/device breakdowns.
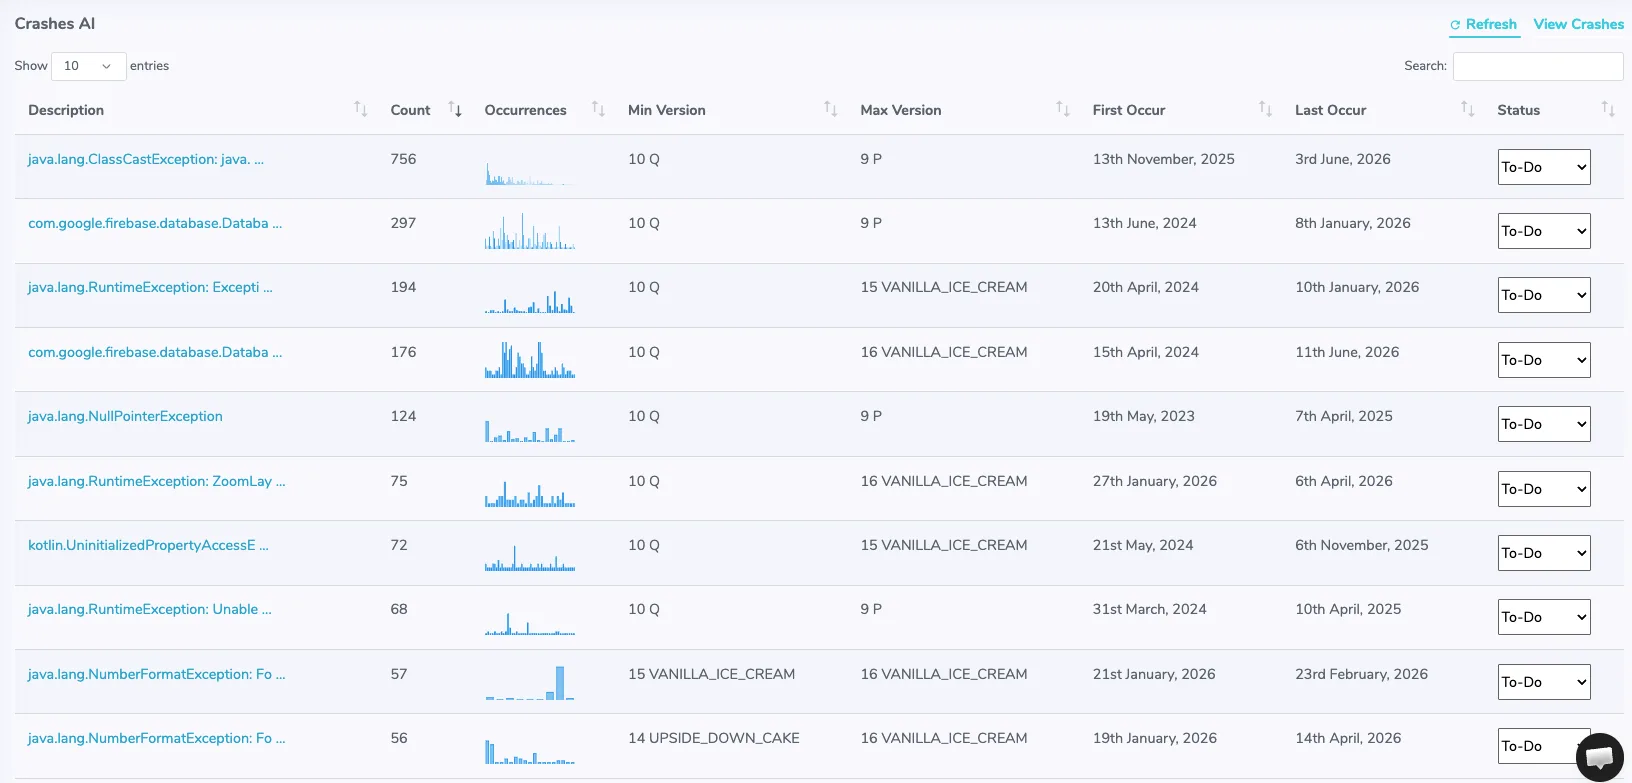
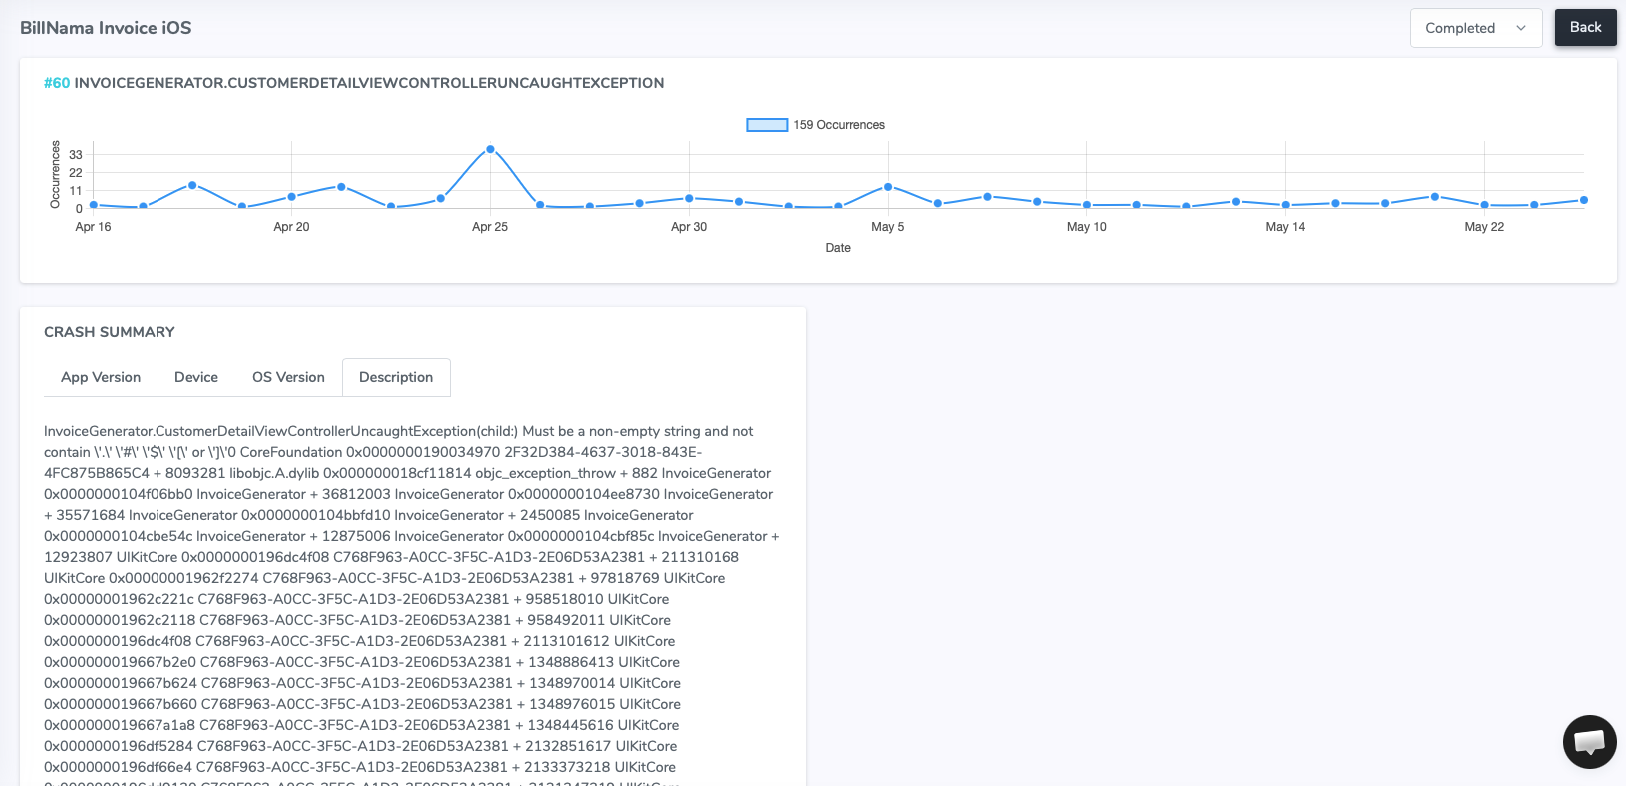
Never debug raw memory hex addresses like 0x0000000104f28a30 again. Shakebug automatically symbolicates iOS dSYMs and de-obfuscates Android ProGuard / R8 mapping files in real time.
Engineers see clear method names, file paths, and exact line numbers. For cross-platform apps, Shakebug maps Flutter Dart exceptions and React Native JavaScript bundles straight to source files.
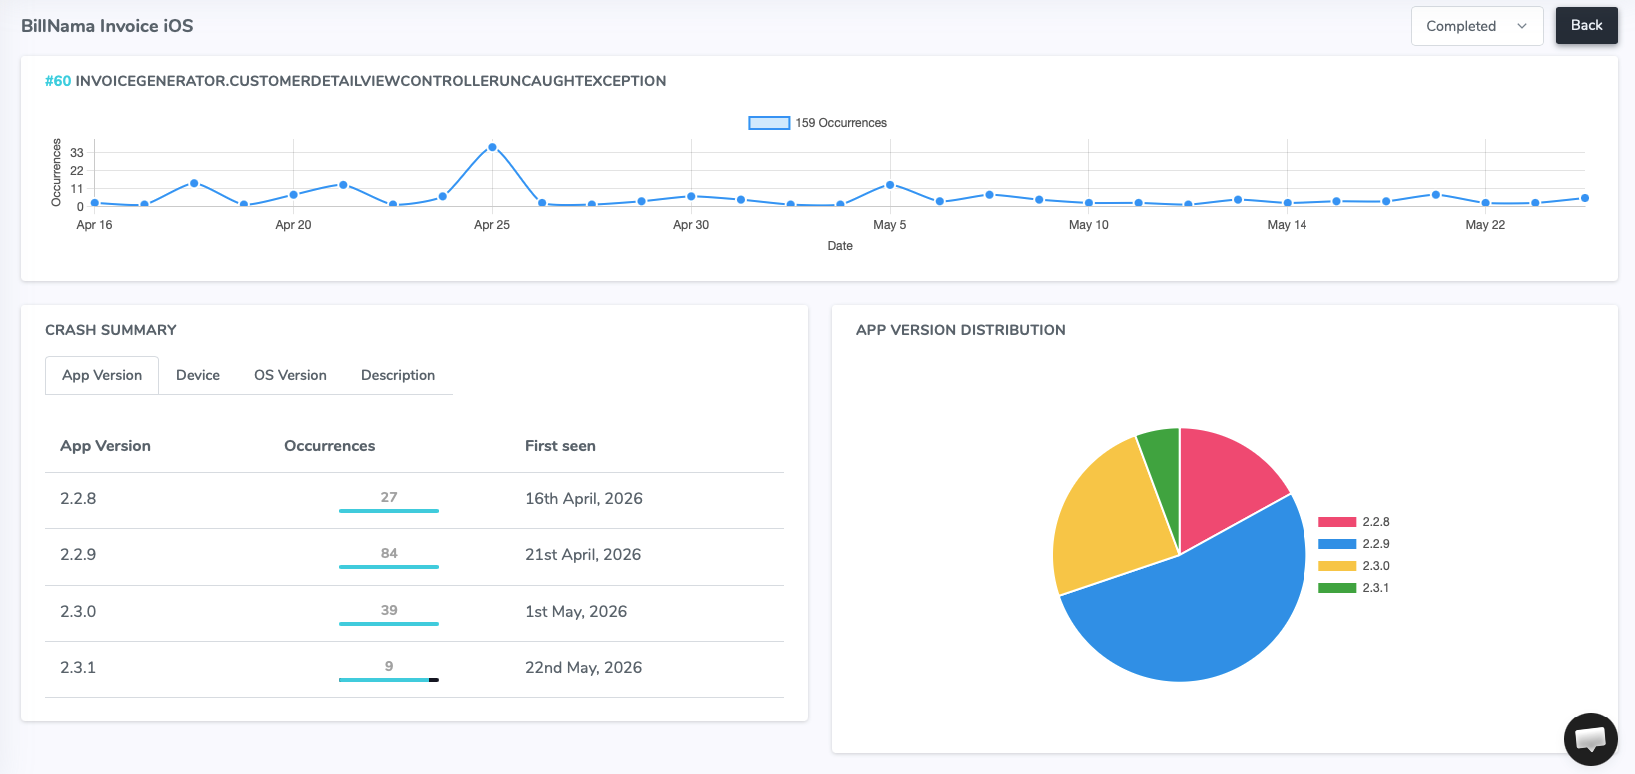
Phased rollouts to Google Play or Apple App Store require instant stability visibility. Shakebug compares your latest release against baseline builds in real time.
Spot whether build 3.2.0 introduces a critical regression within minutes of release. Compare crash-free session curves, track adoption velocity, and decide whether to halt a rollout before negative app reviews accumulate.
Mobile platforms crash differently. A low-memory termination (OOM) on iOS looks completely distinct from an Android Application Not Responding (ANR) lock.
Shakebug handles native signals, unhandled Swift errors, Kotlin coroutine exceptions, and cross-platform bridge crashes natively. Breadcrumbs capture the sequence of screen views and network events leading up to the crash so reproduction is painless.
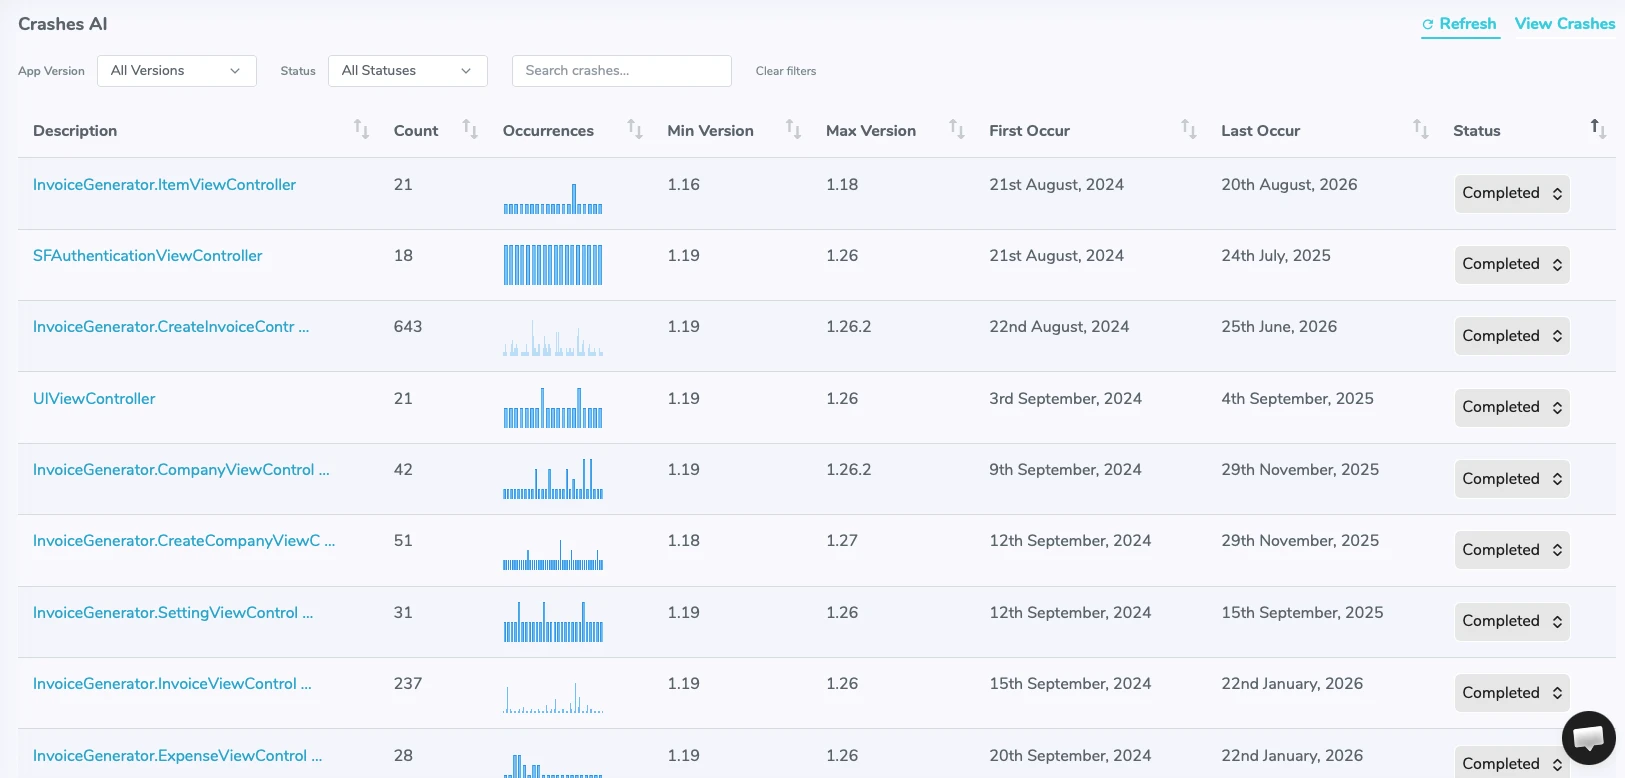
From fatal operating system termination signals to silent bridge errors, get 360-degree stability coverage.
SIGSEGV, SIGABRT, EXC_BAD_ACCESS, memory corruption, unhandled NSException, and Swift fatalError calls.
NullPointerExceptions, OutOfMemoryErrors, background worker failures, and native C/C++ NDK library aborts.
Dart unhandled async exceptions, Flutter render overflow errors, JS thread crashes, and native bridge timeouts.
Clear, direct answers regarding crash capture, symbolication, and production reliability.
Integrate Shakebug in 5 minutes and achieve 99.9% crash-free stability across iOS, Android, Flutter, and React Native.
Sign up freeNo credit card required • Full Crash AI grouping included • Instant setup