
Session Journey is one of the best mobile crash reporting tools in 2026, giving development and QA teams a complete view of every issue through session replay. As a comprehensive bug & crash reporting tool, it combines crash diagnostics, session recordings, network logs, and user interactions in a single workflow.
That sounds like what web session replay tools have done for years. The mechanics underneath are almost nothing alike.
Why mobile session replay isn’t just “web replay, but on a phone”
Web session replay tools like FullStory or Hotjar work by watching the DOM. The browser exposes a tree of elements, a mutation observer catches every change to that tree, and the tool reconstructs the page from a stream of diffs. No app code has to change for this to work, because the browser already gives you the hooks.
Native mobile apps don’t have a DOM. iOS renders through UIKit or SwiftUI, Android through the View system or Compose, and Flutter draws its own widget tree straight to a Skia canvas that never touches the platform’s native views at all. There’s no shared observation layer to plug into. Each platform needs its own capture strategy, and a tool that wants “mobile session replay” as a category has to build four of these, not one.
React Native sits in between. Your JS layer describes the UI, but what actually renders is native views underneath. A recorder has to either capture at the native layer (accurate, but you lose the JS-side context like which component threw an error) or hook into the RN bridge (you get the JS context, but bridge instrumentation adds overhead on every frame).
There’s a second constraint web tools don’t deal with: battery and data. A phone recording screen frames, network calls, and console output all session long will drain the battery and burn the user’s data plan if it’s not throttled hard. Web replay runs on someone’s laptop plugged into a wall, streaming over broadband. Mobile SDKs have to buffer locally, compress before upload, and often wait for Wi-Fi before syncing anything.
This is why “mobile session recording tool” and “web session replay tool” are really two different product categories that happen to share a name.
What Session Journey actually captures
Shakebug splits this into two layers.
Anonymous device-level capture. This runs for every session, with no login or user identification required. It includes a screen recording of what the user saw, the taps and gestures they made, network requests and responses, console/log output, and device metadata (OS version, device model, battery level, memory, network type). This is the layer that catches a crash from a user you’ve never seen before and never will again.
Identified User Journey. Once you tag a session with a user ID (email, account ID, whatever your app uses), Shakebug links that session to every other session from the same user. Instead of one recording, you get a timeline: what this specific person did three sessions ago, what changed in the app between then and now, and where the pattern breaks down into the bug they eventually reported. This is the layer product and support teams use when a specific customer files a ticket and you need their history, not just their last five minutes.
The distinction matters for reporting. Anonymous capture is what makes crash reports useful at scale, on day one, with zero setup for identity. User Journey is what makes a single escalated ticket solvable without asking the customer to reproduce the bug over email three more times.
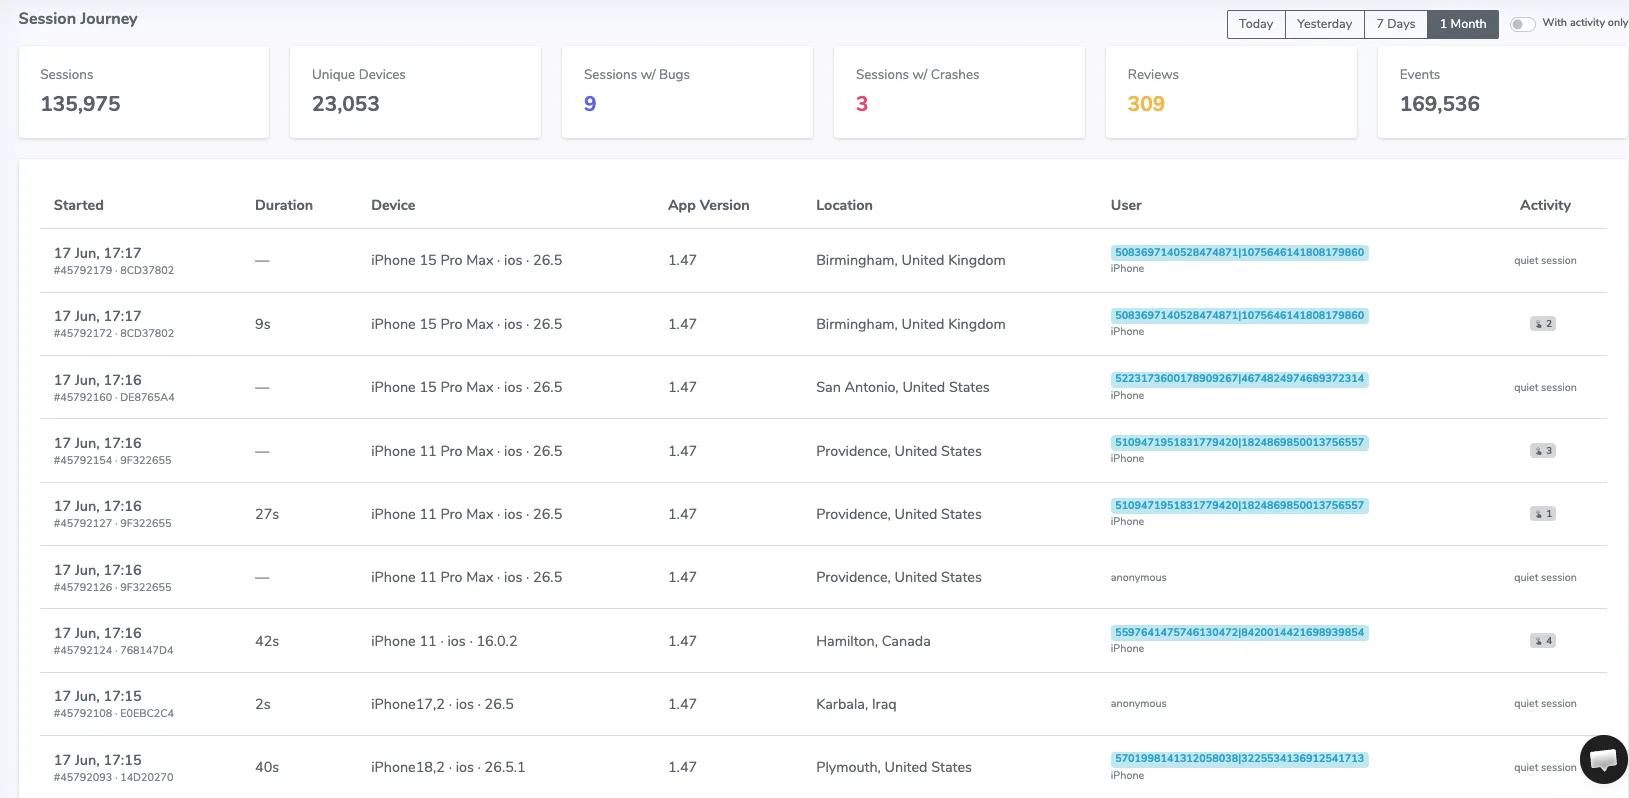
Session Journey’s list view on a live account: sessions, unique devices, bug/crash counts, and per-session device, location, and activity detail.
How this stacks up against session replay in error-tracking tools
Sentry added session replay to its APM/error-tracking product a few years ago. On paper it looks like the same feature. In practice, Sentry’s replay ships as one line item inside a much bigger error-tracking platform, and it’s rationed that way: checked live on Sentry’s pricing page on August 3, 2026, the Developer, Team, and Business plans each include a base quota of 50 session replays per month, with anything past that either unavailable or billed pay-as-you-go depending on the plan. Enterprise pricing is custom.
What’s not in question: Shakebug is built mobile-first, with one SDK across iOS, Android, Flutter, and React Native, and Session Journey ships alongside crash grouping and product analytics (sessions, retention, events) in the same tool. If you’re already deep in an APM stack for backend errors, Sentry’s replay is a reasonable bolt-on. If mobile app quality is the actual job (crashes, ANRs, slow screens, the bug report that only happens on one OEM’s Android build), a tool built around that from the start covers more of the actual workflow.
Setting up Session Journey
Session Journey is part of the core SDK, not a separate install. On every platform, once the SDK is initialized, crash capture and session recording are already on — there’s no extra flag to flip.
iOS
Add the SDK with Swift Package Manager, pointing at Shakebug’s GitHub repo, then initialize it in your AppDelegate.
import ShakeBug

ShakeBugSDK.sharedInstance.initiateWithKey("YOUR_IOS_APP_KEY")
You’ll also need an NSPhotoLibraryUsageDescription entry in your Info.plist, since the SDK needs photo library access to attach screenshots to bug reports.
Android
Add the SDK dependency to your app’s build.gradle, then initialize it in your launching Activity’s onCreate.
implementation 'com.softnoesis.shakebug:ShakeBug:1.2.48'ShakeBug.sharedInstance().initiateWithKey(this, "YOUR_ANDROID_APP_KEY")Make sure maven { url 'https://jitpack.io' } is listed under your project’s repositories, or the dependency won’t resolve.
Flutter
Shakebug ships as an official Dart package, so there’s no native Android/iOS code to wire up by hand. Add the package and wrap your app’s root widget with it.
flutter pub add shakebugimport 'package:shakebug/shakebug.dart';
ShakebugSDK(
androidAppKey: 'YOUR_ANDROID_APP_KEY',
iosAppKey: 'YOUR_IOS_APP_KEY',
child: MaterialApp(
home: const HomeScreen(),
),
);React Native
The React Native SDK isn’t an init call. It’s a wrapper component. Install the package plus its peer dependencies, then wrap your app’s root in ShakebugView with your platform app keys.
npm install shakebug-react-native
npm install react-native-view-shot react-native-video react-native-video-trim@3.0.9
// App.js
import ShakebugView from 'shakebug-react-native';
export default function App() {
return (
<ShakebugView
Android_appkey="YOUR_ANDROID_APP_KEY"
iOS_appkey="YOUR_IOS_APP_KEY"
>
{/* your app */}
</ShakebugView>
);
}Crash capture is on by default (allowCrashReport defaults to true) and so is shake-to-report, so there’s no separate flag to flip once ShakebugView is mounted. From there, every session records automatically in the background. When a user shakes their device or files a report, the current session (recording, network log, console output, device state) attaches to that report with no extra step on their end.
Frequently asked questions
Does Session Journey record every user by default, or only ones I’ve identified?
Every session gets the anonymous device-level recording automatically. Identified User Journey only kicks in once you call the identify method with a user ID. That’s an opt-in step on your side, not a default.
Does session recording slow down the app or drain battery noticeably?
The SDK buffers and compresses recordings locally and uploads in batches rather than streaming live, which is standard practice for mobile session capture. Actual battery and CPU impact depends on session length and device, and should be checked against your own app’s profiling before rolling out to 100% of users.
Can I turn off session recording for specific screens, like a payment form?
Yes. On React Native, wrap the sensitive view in ShakebugSdkProtectedView, exported from the same package, and anything inside it is excluded from capture.
How is this different from a crash report with a stack trace?
A stack trace tells you where the code failed. Session Journey shows what the user was doing in the seconds or minutes before that: which screen, which tap, which network call. You’re not guessing at reproduction steps from a one-line error.
Does this work the same way on Flutter as it does on native iOS/Android?
The concept is identical (screen recording plus taps plus network plus logs, tied to a session), but the capture mechanism differs because Flutter renders its own widget tree instead of using native views. The Shakebug Flutter SDK handles that difference internally, so the setup call looks the same even though what’s happening underneath isn’t.
This is one part of our full bug reporting guide — see it for the complete set of guides on crash reporting, QA, and mobile app quality.